WPF Toolkit Charting Controls is a dated assembly that allows to create line, bar, area, pie and column charts (it is possible to find an exhaustive and very tutorial on CodeProject about how to use it). It is a really ready to use tool, but sometimes it lacks some useful features.
In my case the pie chart does not allow to show labels with percentage on each pie area. It is a real pity.
Since each pie area is rendered by using a Geometry, my idea is to add something (i.e. another Geometry) to the one already computed. Areas are a handled by the PieDataPoint class. So we can get the Geometry computed by PieDataPoint, then add a new Geometry with the relative parcentage value and the use this new composition for drawing the area in the chart.
For manipulating the Geometry, a new control which extends the original one is needed:
public class PieDataPoint : System.Windows.Controls.DataVisualization.Charting.PieDataPoint
{
    public static readonly DependencyProperty TextedGeometryProperty =
        DependencyProperty.Register("TextedGeometry", typeof(Geometry), typeof(PieDataPoint));

    public Geometry TextedGeometry
    {
        get { return (Geometry)GetValue(TextedGeometryProperty); }
        set { SetValue(TextedGeometryProperty, value); }
    }

    static PieDataPoint()
    {
        DefaultStyleKeyProperty.OverrideMetadata(typeof(PieDataPoint),
            new FrameworkPropertyMetadata(typeof(PieDataPoint)));
    }

    public PieDataPoint()
    {
        DependencyPropertyDescriptor dependencyPropertyDescriptor
            = DependencyPropertyDescriptor.FromProperty(GeometryProperty, GetType());

        dependencyPropertyDescriptor.AddValueChanged(this, OnGeometryValueChanged);
    }

    private double LabelFontSize
    {
        get
        {
            FrameworkElement parentFrameworkElement = Parent as FrameworkElement;
            return Math.Max(8, Math.Min(parentFrameworkElement.ActualWidth,
                parentFrameworkElement.ActualHeight) / 30);
        }
    }

    private void OnGeometryValueChanged(object sender, EventArgs arg)
    {
        Point point;
        FormattedText formattedText;

        CombinedGeometry combinedGeometry = new CombinedGeometry();
        combinedGeometry.GeometryCombineMode = GeometryCombineMode.Exclude;

        formattedText = new FormattedText(FormattedRatio,
            CultureInfo.CurrentCulture,
            FlowDirection.LeftToRight,
            new Typeface("Arial"),
            LabelFontSize,
            Brushes.White);

        if (ActualRatio == 1)
        {
            EllipseGeometry ellipseGeometry = Geometry as EllipseGeometry;

            point = new Point(ellipseGeometry.Center.X - formattedText.Width / 2,
                ellipseGeometry.Center.Y - formattedText.Height / 2);
        }
        else if (ActualRatio == 0)
        {
            TextedGeometry = null;
            return;
        }
        else
        {
            Point tangent;
            Point half;
            Point origin;

            PathGeometry pathGeometry = Geometry as PathGeometry;
            pathGeometry.GetPointAtFractionLength(.5, out half, out tangent);
            pathGeometry.GetPointAtFractionLength(0, out origin, out tangent);

            point = new Point(origin.X + ((half.X - origin.X) / 2) - formattedText.Width / 2,
                origin.Y + ((half.Y - origin.Y) / 2) - formattedText.Height / 2);

        }

        combinedGeometry.Geometry1 = Geometry;
        combinedGeometry.Geometry2 =  formattedText.BuildGeometry(point);

        TextedGeometry = combinedGeometry;
    }
}
When the original Geometry property changes, custom PieDataPoint computes a new Geometry (called TextedGeometry) composed by the original one and a new one obtained with a FormattedText.
Next step is to create the default style (the static constructor of our PieDataPoint tells to WPF to use it. So let’s add a “generic.xaml” dictionary to our assembly in the themes folder. The “generic.xaml” must have Page as build action.
<ResourceDictionary xmlns="http://schemas.microsoft.com/winfx/2006/xaml/presentation"                     xmlns:x="http://schemas.microsoft.com/winfx/2006/xaml"                     xmlns:vsm ="clr-namespace:System.Windows;assembly=PresentationFramework"                     xmlns:chartingToolkit="clr-namespace:System.Windows.Controls.DataVisualization.Charting;assembly=System.Windows.Controls.DataVisualization.Toolkit"                     xmlns:local="clr-namespace:DYKZ.DataVisualization.Charting">
<Style TargetType="{x:Type local:PieDataPoint}">
        <Setter Property="Control.Background" Value="#FFFFA500" />
        <Setter Property="Control.BorderBrush" Value="#FFFFFFFF" />
        <Setter Property="Control.BorderThickness" Value="1" />
        <Setter Property="Control.IsTabStop" Value="False" />
        <Setter Property="chartingToolkit:PieDataPoint.RatioStringFormat" Value="{}{0:p2}" />
        <Setter Property="Control.Template">
            <Setter.Value>
                <ControlTemplate TargetType="{x:Type local:PieDataPoint}">
                    <Grid Name="Root" Opacity="0">
                        <vsm:VisualStateManager.VisualStateGroups>
                            <vsm:VisualStateGroup x:Name="CommonStates">
                                <vsm:VisualStateGroup.Transitions>
                                    <VisualTransition GeneratedDuration="0:0:0.1" />
                                </vsm:VisualStateGroup.Transitions>
                                <vsm:VisualState x:Name="Normal" />
                                <vsm:VisualState x:Name="MouseOver">
                                    <Storyboard>
                                        <DoubleAnimation Storyboard.TargetName="MouseOverHighlight" Storyboard.TargetProperty="Opacity" To="0.6" Duration="0" />
                                    </Storyboard>
                                </vsm:VisualState>
                            </vsm:VisualStateGroup>
                            <vsm:VisualStateGroup x:Name="SelectionStates">
                                <vsm:VisualStateGroup.Transitions>
                                    <VisualTransition GeneratedDuration="0:0:0.1" />
                                </vsm:VisualStateGroup.Transitions>
                                <vsm:VisualState x:Name="Unselected" />
                                <vsm:VisualState x:Name="Selected">
                                    <Storyboard>
                                        <DoubleAnimation Storyboard.TargetName="SelectionHighlight" Storyboard.TargetProperty="Opacity" To="0.6" Duration="0" />
                                    </Storyboard>
                                </vsm:VisualState>
                            </vsm:VisualStateGroup>
                            <vsm:VisualStateGroup x:Name="RevealStates">
                                <vsm:VisualStateGroup.Transitions>
                                    <VisualTransition GeneratedDuration="0:0:0.5" />
                                </vsm:VisualStateGroup.Transitions>
                                <vsm:VisualState x:Name="Shown">
                                    <Storyboard>
                                        <DoubleAnimation Storyboard.TargetName="Root" Storyboard.TargetProperty="Opacity" To="1" Duration="0" />
                                    </Storyboard>
                                </vsm:VisualState>
                                <vsm:VisualState x:Name="Hidden">
                                    <Storyboard>
                                        <DoubleAnimation Storyboard.TargetName="Root" Storyboard.TargetProperty="Opacity" To="0" Duration="0" />
                                    </Storyboard>
                                </vsm:VisualState>
                            </vsm:VisualStateGroup>
                        </vsm:VisualStateManager.VisualStateGroups>
                        <Path Name="Slice" Data="{TemplateBinding local:PieDataPoint.TextedGeometry}"                                    Fill="{TemplateBinding Control.Background}"                                    Stroke="{TemplateBinding Control.BorderBrush}"                                    StrokeMiterLimit="1">
                            <ToolTipService.ToolTip>
                                <StackPanel>
                                    <ContentControl Content="{TemplateBinding chartingToolkit:DataPoint.FormattedDependentValue}" />
                                    <ContentControl Content="{TemplateBinding chartingToolkit:PieDataPoint.FormattedRatio}" />
                                </StackPanel>
                            </ToolTipService.ToolTip>
                        </Path>
                        <Path Name="SelectionHighlight" Data="{TemplateBinding chartingToolkit:PieDataPoint.GeometrySelection}" Fill="#FFFF0000" StrokeMiterLimit="1" IsHitTestVisible="False" Opacity="0" />
                        <Path Name="MouseOverHighlight" Data="{TemplateBinding chartingToolkit:PieDataPoint.GeometryHighlight}" Fill="#FFFFFFFF" StrokeMiterLimit="1" IsHitTestVisible="False" Opacity="0" />
                    </Grid>
                </ControlTemplate>
            </Setter.Value>
        </Setter>
    </Style>

</ResourceDictionary>
The most important part of our default style is that the Slice path uses the TextedGeometry property (and not the default one).
Now we need just a custom (and very simple) PieSeries which uses our custom PieDataPoint:
public class PieSeries : System.Windows.Controls.DataVisualization.Charting.PieSeries
{
    protected override DataPoint CreateDataPoint()
    {
        return new PieDataPoint();
    }
}
Now let’s use our custom control in the xaml:
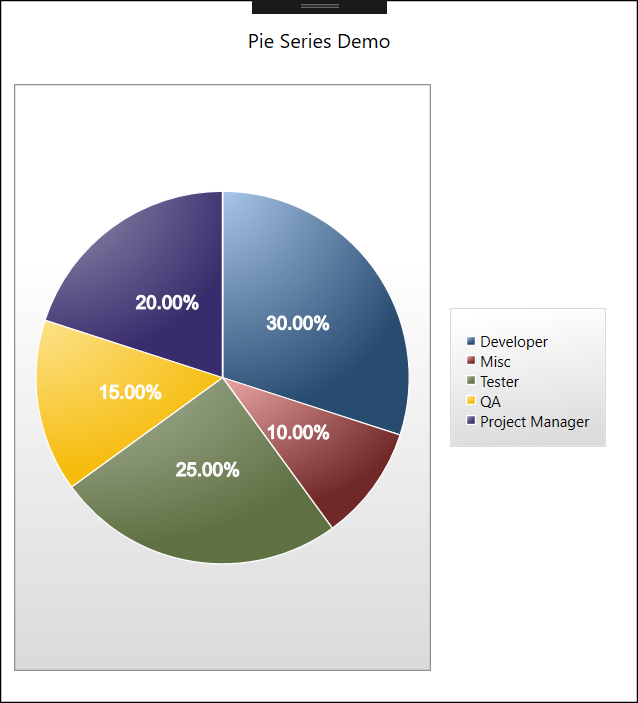
<chartingToolkit:Chart Name="pieChart" Title="Pie Series Demo">
            <local:PieSeries DependentValuePath="Value" IndependentValuePath="Key"                              ItemsSource="{Binding}" IsSelectionEnabled="True" />

        </chartingToolkit:Chart>
and we can see the percentage labels:

I have been trying to add labels to pie chart using the code of your blog in visual studio 2019 for the last three days. But I failed and pie chart does not show anything. It returns blank. Legend is available. Can your share your full code with me.
LikeLike
I have spent 5 hours to get this works.
My mistake was using old version of Toolkit V.3.5
For any one who might face the same issue, just download the package from console
Install-Package System.Windows.Controls.DataVisualization.Toolkit -Version 4.0.0
LikeLike